Choose the first area to investigate
Compare population, patients, clinics, and hotspots for three areas by the same criteria and explain the follow-up order.
This step's question
Which area should be checked first: Junggye 4-dong, Seongnam-dong, or Junggye Bon-dong?
Why this matters now
A priority should not be based on graph node count or patient count alone. Compare population scale, patients, clinics, and hotspots for the same period and by the same criteria before choosing the follow-up order.
Try it yourself
Run this aggregate query in the Graph Explorer query console.
MATCH (d:dong)
WHERE d.dong IN ['중계4동', '성남동', '중계본동']
OPTIONAL MATCH (p:patient)-[:resides_in]->(d)
WITH d, count(DISTINCT p) AS patient_count
OPTIONAL MATCH (c:clinic)-[:located_in]->(d)
WITH d, patient_count, count(DISTINCT c) AS clinic_count
OPTIONAL MATCH (h:hotspot)-[:within]->(d)
WITH d, patient_count, clinic_count, count(DISTINCT h) AS hotspot_count
RETURN
  d.dong AS 동,
  d.sigungu AS 시군구,
  d.residents_population AS 거주인구,
  d.float_population AS 유동인구,
  patient_count AS 환자수,
  clinic_count AS 진료소수,
  hotspot_count AS 핫스팟수
ORDER BY 환자수 DESC, 핫스팟수 DESC
The query first selects Junggye 4-dong, Seongnam-dong, and Junggye Bon-dong from the dong
entities. It uses OPTIONAL MATCH to count the distinct patients, clinics, and hotspots related to each
dong, so an area remains in the output even when one of those counts is zero. It sorts by patient count,
then by hotspot count when patient counts are equal.
Because the query returns aggregates rather than nodes, select the Table result view. Confirm that the table contains three rows.
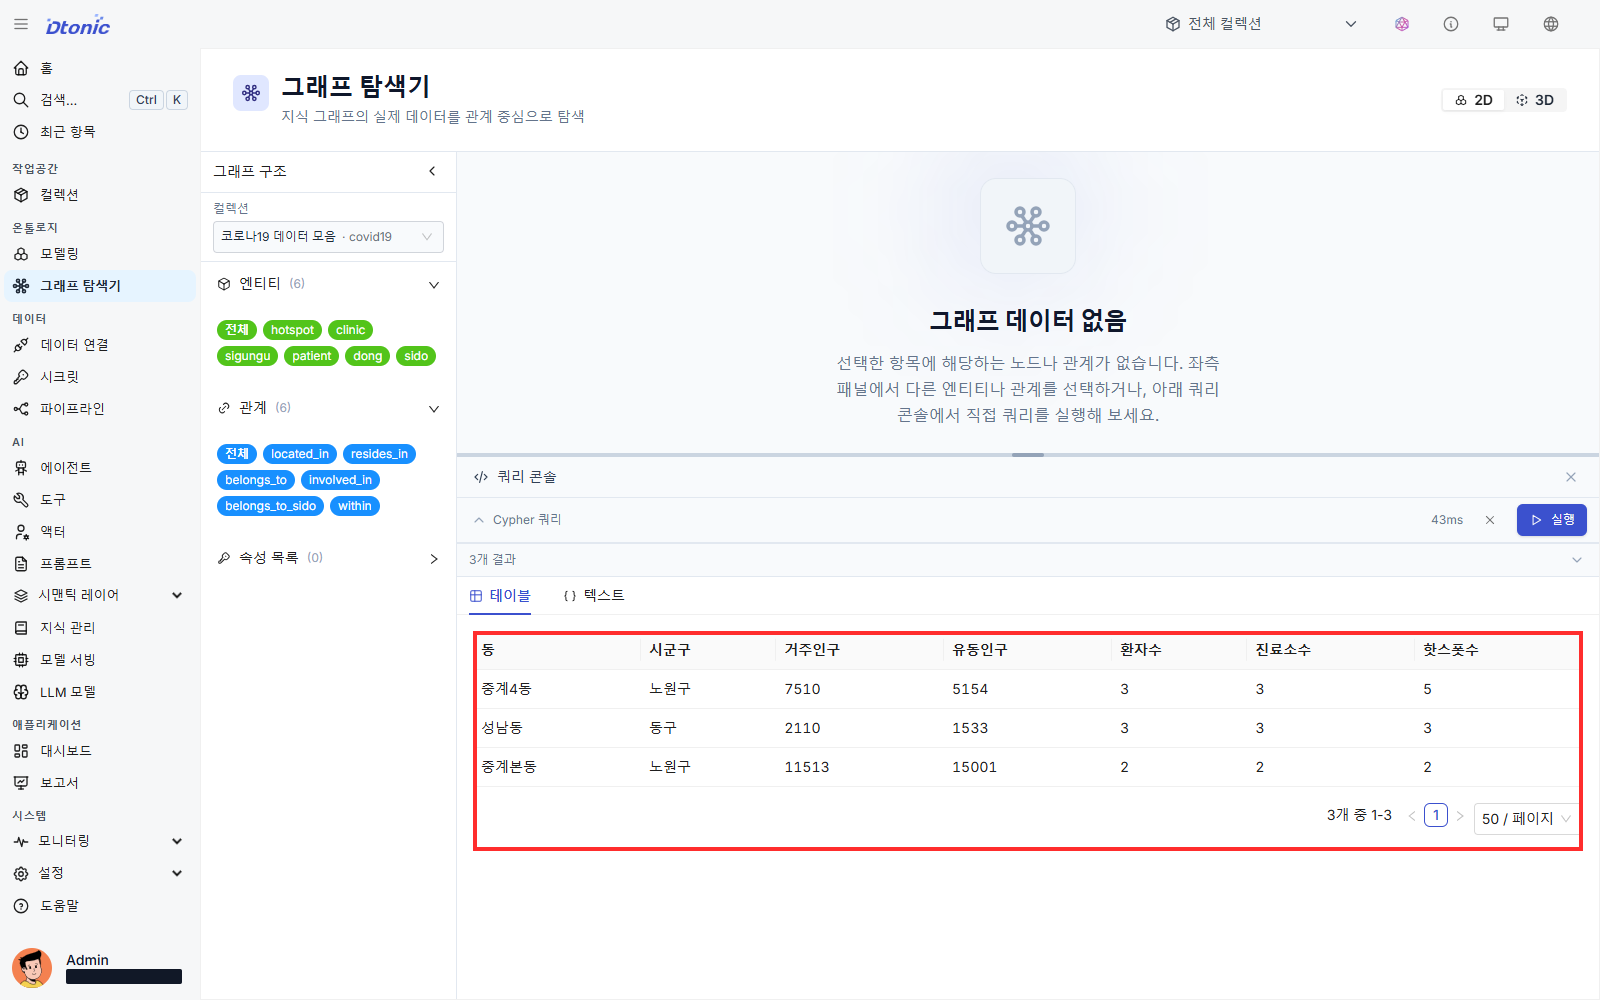
This screen means success
The Portal Table tab should show three rows with 동, 시군구, 거주인구, 유동인구,
환자수, 진료소수, and 핫스팟수, as in the screenshot.
The analysis table below applies this workshop's decision rule to those seven retrieved values.
Patients per 10,000 is patient count × 10,000 ÷ resident population. Signals met counts how
many of the patient-count, hotspot-count, and per-10,000 thresholds from the previous chapter are met.
Analysis table derived from the query result
| Order | Area | Patients | Hotspots | Patients per 10,000 | Clinics | Signals met |
|---|---|---|---|---|---|---|
| 1 | Junggye 4-dong | 3 | 5 | 3.99 | 3 | 2 |
| 2 | Seongnam-dong | 3 | 3 | 14.22 | 3 | 2 |
| 3 | Junggye Bon-dong | 2 | 2 | 1.74 | 2 | 0 |
Read the result
Junggye 4-dong and Seongnam-dong each meet two of the three signals. Junggye 4-dong exceeds the patient and hotspot thresholds; Seongnam-dong exceeds the patient and patients-per-10,000 thresholds. Because this investigation starts with movement intersections, choose Junggye 4-dong first: it has five hotspots, the larger count among areas tied on patient count. Check Seongnam-dong second because its population-adjusted patient signal is the largest. Keep Junggye Bon-dong under monitoring.
| Reading order | Observation across the three reports | Analytical interpretation |
|---|---|---|
| 1. Number of signals met | Junggye 4-dong 2, Seongnam-dong 2, Junggye Bon-dong 0 | The first two areas are follow-up candidates. |
| 2. Signal most relevant to the investigation | Junggye 4-dong has 5 hotspots; Seongnam-dong has 3. | Start the movement review with Junggye 4-dong. |
| 3. Population-adjusted value not to overlook | Seongnam-dong has 14.22 patients per 10,000. | Follow immediately with Seongnam-dong. |
| 4. Response context | Clinic counts are 3, 3, and 2. | Counts are visible, but hours and capacity still need checking. |
Report it to the situation room
Applying the same criteria to all three reports, Junggye 4-dong and Seongnam-dong each meet two alert signals. Because the current objective is to investigate movement intersections, check Junggye 4-dong first because it has five hotspots. Check Seongnam-dong immediately afterward because it has the highest population-adjusted patient value, 14.22 per 10,000, and monitor Junggye Bon-dong. Revise this order after checking hotspot times and data freshness.
The report separates observed facts, the chosen rule, the conclusion, and remaining checks. A recipient can trace why Junggye 4-dong comes first and what new evidence could change the order.
Answer the opening question
Investigate Junggye 4-dong first. It ties for the highest patient count and has five hotspots, the signal most directly related to the movement-intersection objective. Do not omit Seongnam-dong: its population-adjusted signal is larger, so check it second. This uses both the analytical objective and a normalized measure instead of selecting an area from one raw count.
Extend the analysis
- Group
cross_start_timeto separate recent occurrences from older ones. - Add clinic hours or testing availability to compare actual response capacity.
- Display data refresh time so stale observations do not distort the order.
Verification checklist
- You compared all three reports by the same criteria.
- You can explain why Junggye 4-dong comes first and why Seongnam-dong follows immediately.
- You can explain that priority means investigation order, not confirmed risk.
- You can name additional information that could change the order.