Compare resident and floating population
Compare both populations in the joined result and distinguish the question each answers.
Question for this chapter
Why should people who live in an area and people who spend time there be considered together?
Why this matters now
Resident population describes registered living scale; floating population describes people moving through or staying at a particular time. The values can diverge in commercial or employment areas.
Try it
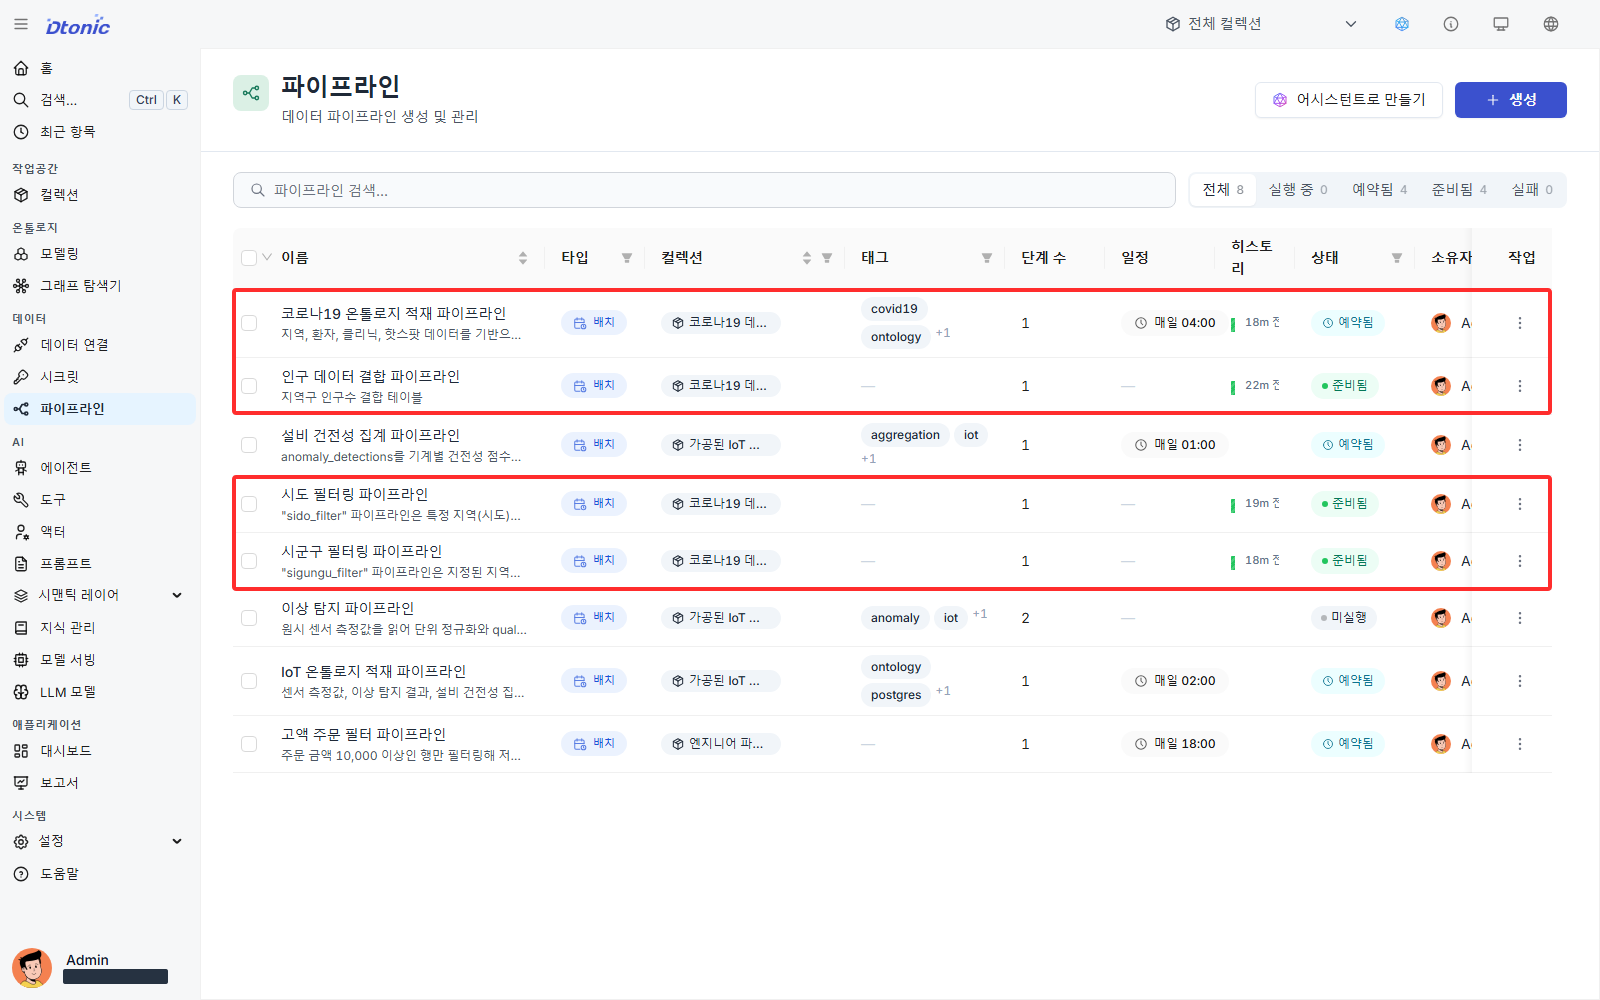
Run Population Data Join Pipeline, Sido Filtering Pipeline, and Sigungu Filtering Pipeline in order. After each run, inspect its latest run time and status.
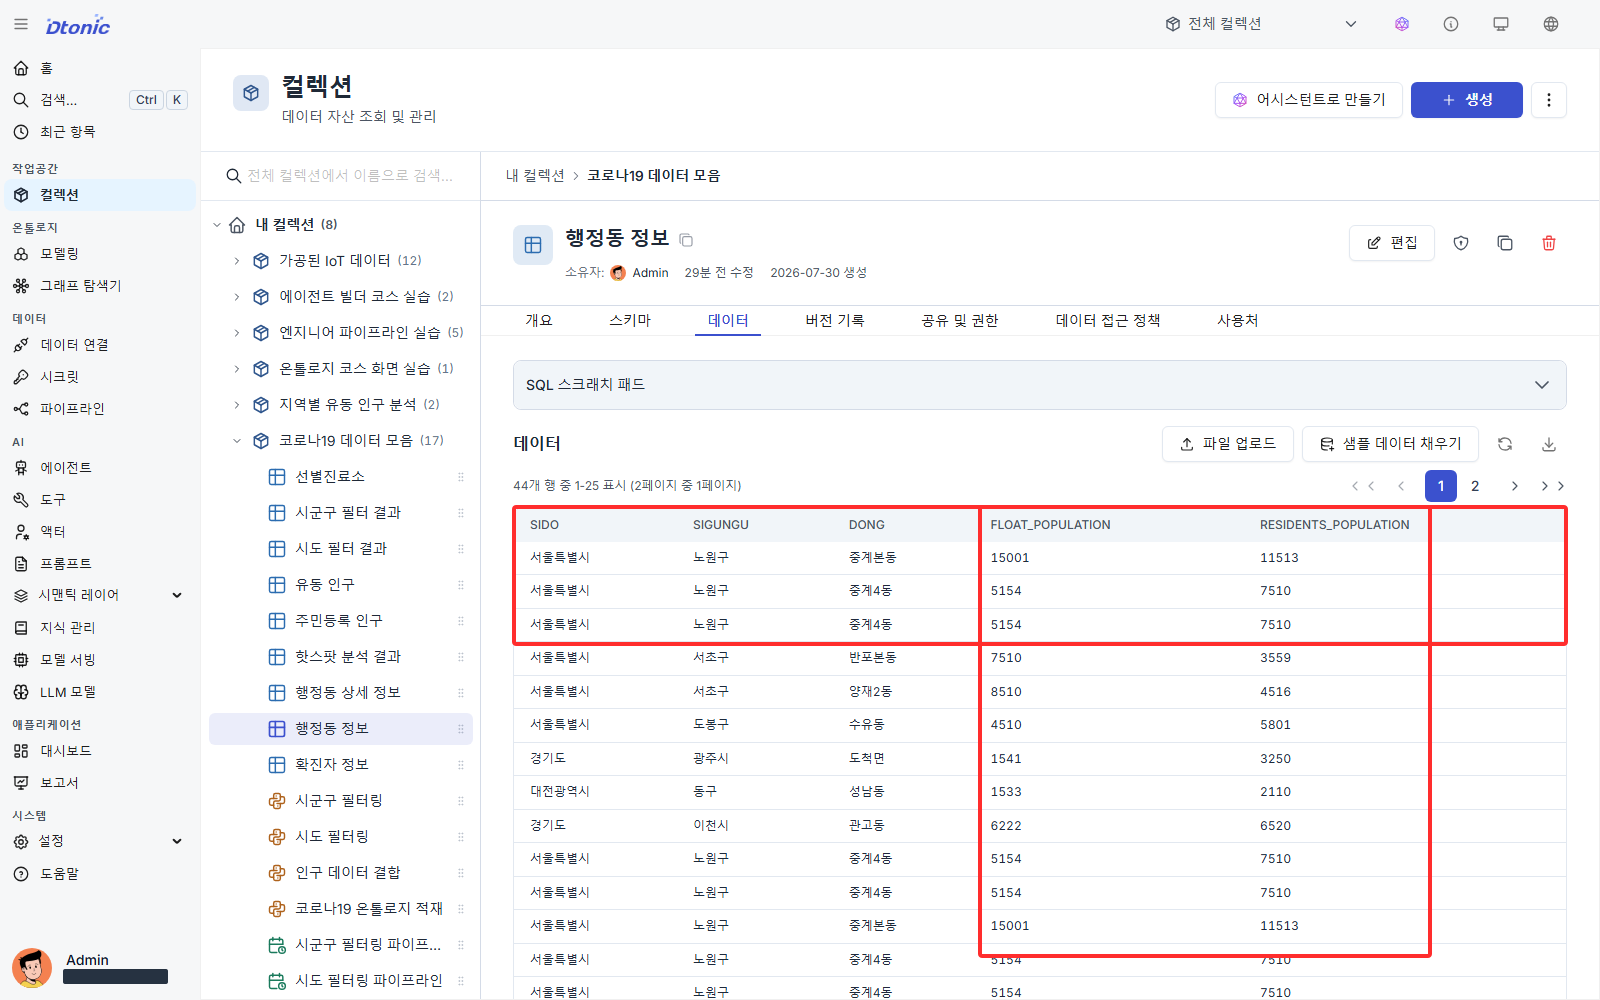
Return to the collection and open Data in Dong Information (region_dong).
Success looks like this
Every row contains residents_population and float_population, and Sido Filter Result
(sido_filter) and Sigungu Filter Result (sigungu_filter) have current versions.
Interpret the result
If resident population is 7,510 and floating population is 5,154, you may say that there are 2,356 more residents in the sample. That difference alone does not establish risk. Patient, clinic, and hotspot context comes next.
| Observed pattern | Possible interpretation | Next value to inspect |
|---|---|---|
| Floating exceeds resident population. | The area may draw commuters or commercial activity. | Hotspot place and time |
| Resident exceeds floating population. | The area may be centered on daily living. | Resident patients and clinic access |
| Both values are large. | Many people may live in and move through the area. | Patient and hotspot rates versus nearby dong |
| One value is empty. | This may be data quality, not a risk signal. | Source time and missing regions |
In Junggye 4-dong, resident population is about 46% larger than floating population. That does not mean “46% higher risk”; it describes a smaller observed moving population relative to registered residents. The next question is how many patients and hotspots connect to this living area.
Next decision
To interpret the population difference, add patients, clinics, and movement intersections for the same dong.