Frame the situation room's first question
Import the COVID-19 training scenario and define the analysis question and asset boundaries.
Question for this chapter
Which data must be connected to name the first area to respond to with evidence?
Today's reports cover Junggye 4-dong, Seongnam-dong, and Junggye Bon-dong. The goal is not to declare a vague “danger area,” but to set the order for checking movement intersections.
Why this matters now
Memorizing an asset list first can separate the execution from its decision purpose. Fix the question: compare patients, population, clinics, and hotspots for the same area.
Try it
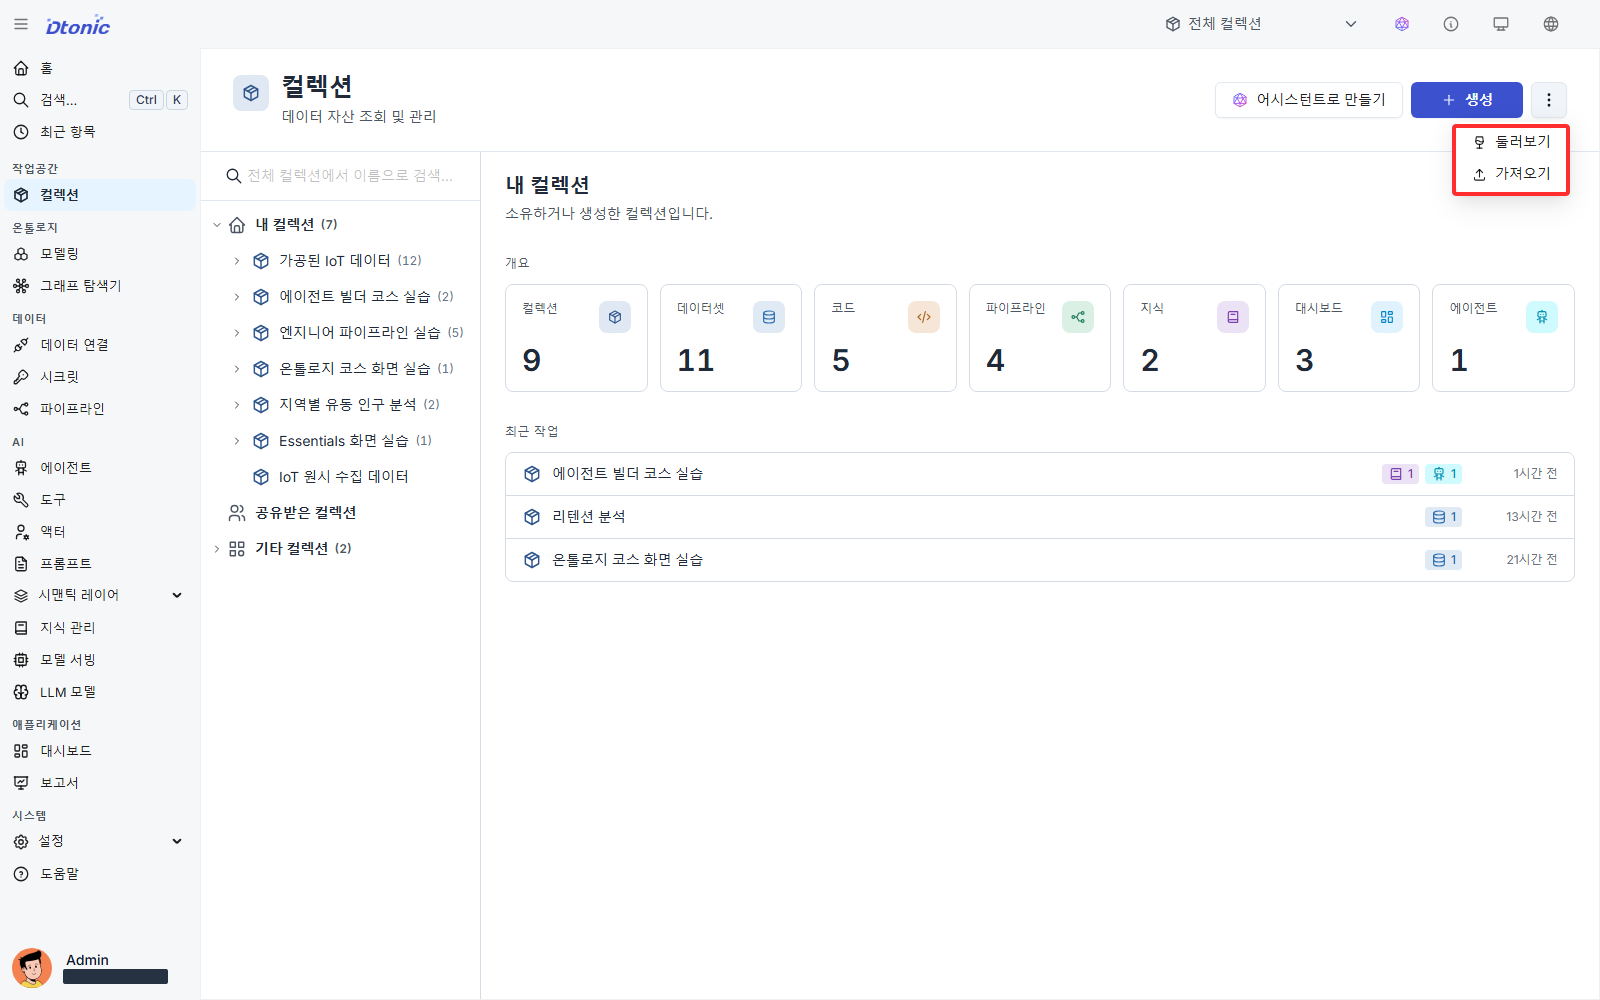
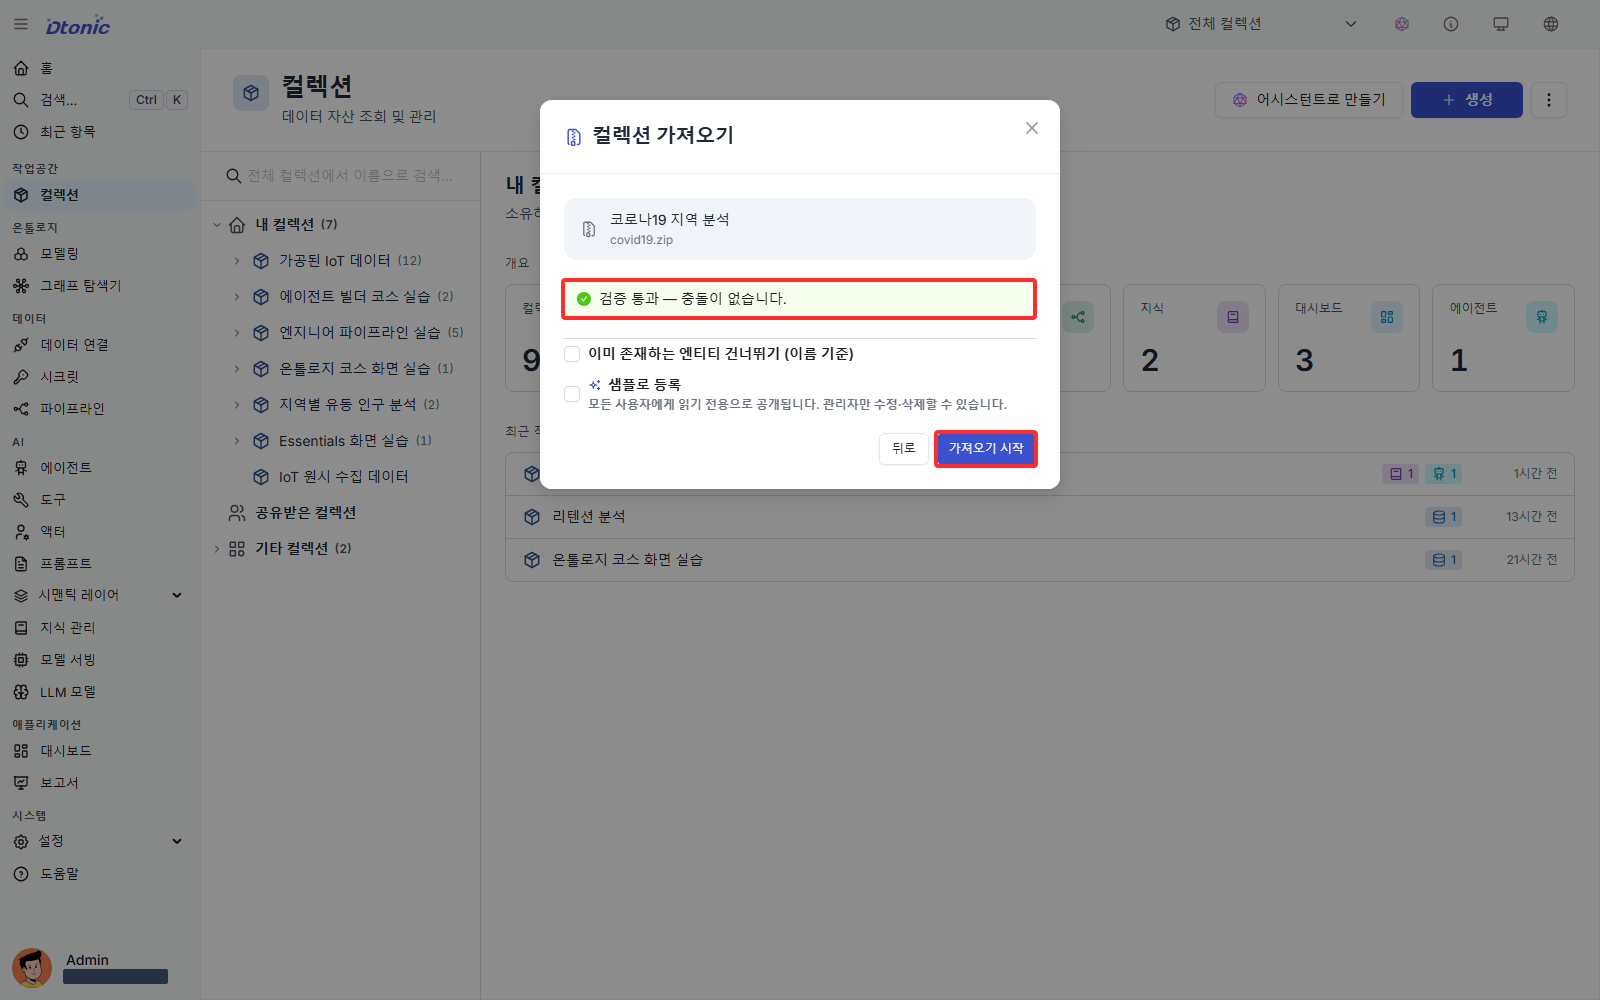
covid19.zip Download(71 KB)Open Collections in the left sidebar and choose More → Import in the upper-right. Upload the ZIP. If validation finds no conflicts, select Start import and wait for completion.
Success looks like this
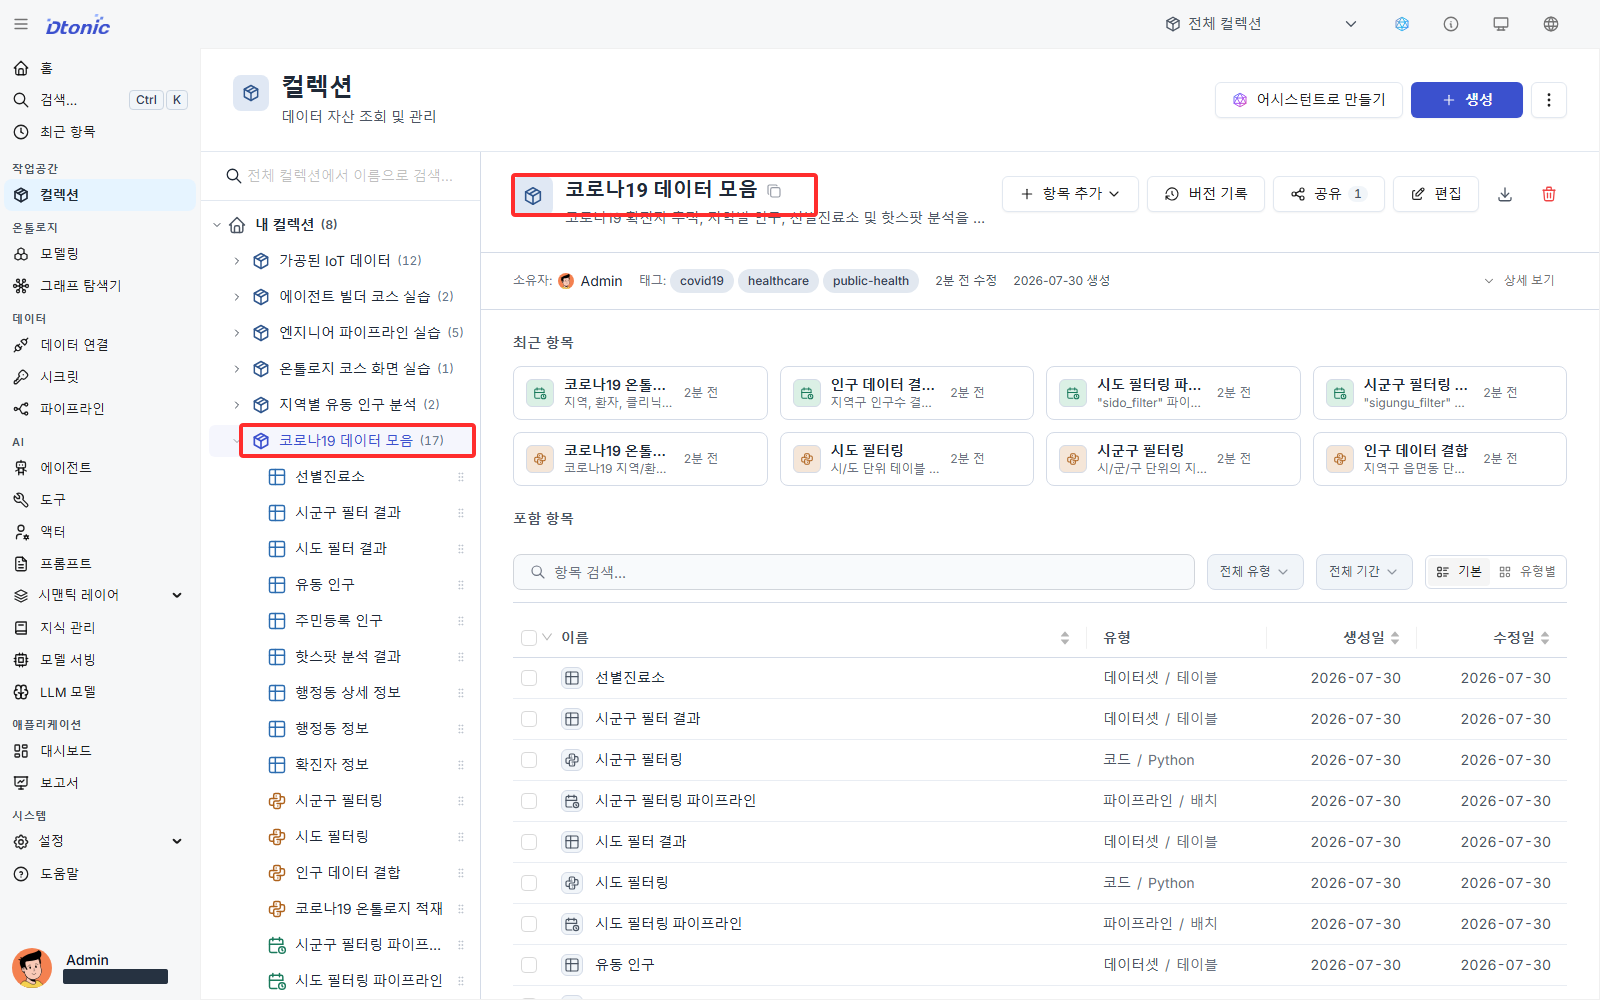
COVID-19 Data Collection appears in the left collection list, and its detail page contains datasets, code, and pipelines.
Interpret the result
This Workshop's final evidence appears in Graph explorer and a query-result table. Each imported asset answers a different analysis question.
| What the asset shows | Question it can answer | Later use |
|---|---|---|
| Population data | How do people who live here differ from people who spend time here? | Compare regional scale and activity. |
| Patient and hotspot data | Where did patient movements intersect with places and areas? | Narrow areas for relationship review. |
| Clinic data | Are clinical resources present around the area? | Explain the follow-up order. |
| Region hierarchy | Which sigungu and sido contain a dong observation? | Report to a higher regional unit. |
Datasets hold individual facts, pipelines make them comparable, and the ontology traces relationships among the facts. The next chapters connect those roles in order.
Use this shared decision table for all three reports:
| Signal | Workshop threshold | Meaning |
|---|---|---|
| Patient count | 3 or more | Several resident patients are observed. |
| Hotspot count | 5 or more | Many movement-intersection places need review. |
| Patients per 10,000 residents | 10 or more | The patient signal remains high after population adjustment. |
An area becomes a priority candidate when it satisfies at least two signals. If candidates tie, put the one with more hotspots first because the current task is movement review. This is a learning rule for synthetic data, not a public-health policy.
Deep dive — imported assets
| Asset type | Count | Contents |
|---|---|---|
| Collection | 1 | COVID-19 Data Collection (covid19) |
| Datasets | 9 | Population, patient, clinic, and hotspot sources plus regional intermediate results |
| Code | 4 | Population join, sido/sigungu filtering, ontology materialization |
| Batch pipelines | 4 | Execution paths for the four code assets |
| Ontology | 6 entities / 6 relations | Region hierarchy, patient, clinic, hotspot, and six connections |
| Tool | 1 | ontology_graph_query |
| Agent | 1 | epidemic_assistant |
The ZIP includes tool and Agent definitions, but the current import surface does not register them.
Next decision
Before connecting data, align a hierarchy such as 서울특별시, 노원구, and 중계4동 so the names
refer to one complete place.