Expand from one dong to the surrounding region
Expand patients and hotspots in Graph Explorer, then trace the path from one dong to its sigungu and sido.
This step's question
Starting with Junggye 4-dong, how can we expand to related patients and higher administrative regions?
Why this matters now
An aggregate for one area shows only the result. A graph path lets you trace which patients, places, and regions contributed to that result.
Try it yourself
Open Graph Explorer from the left navigation, then select the COVID-19 Data Collection
(covid19) from the collection filter.
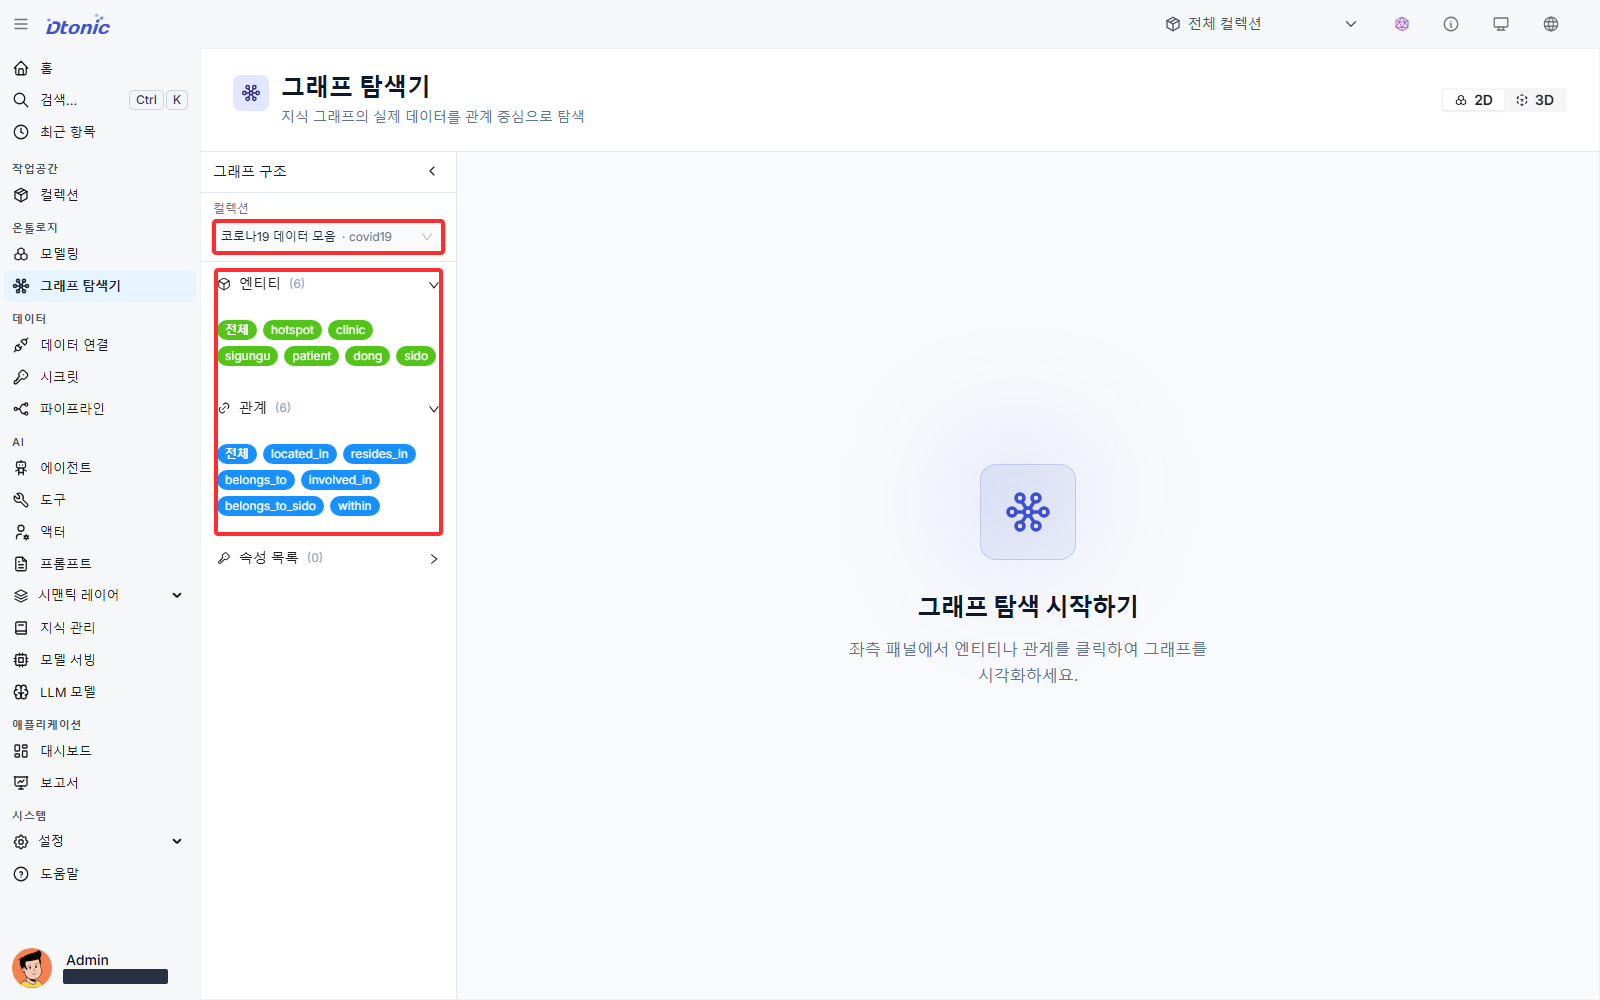
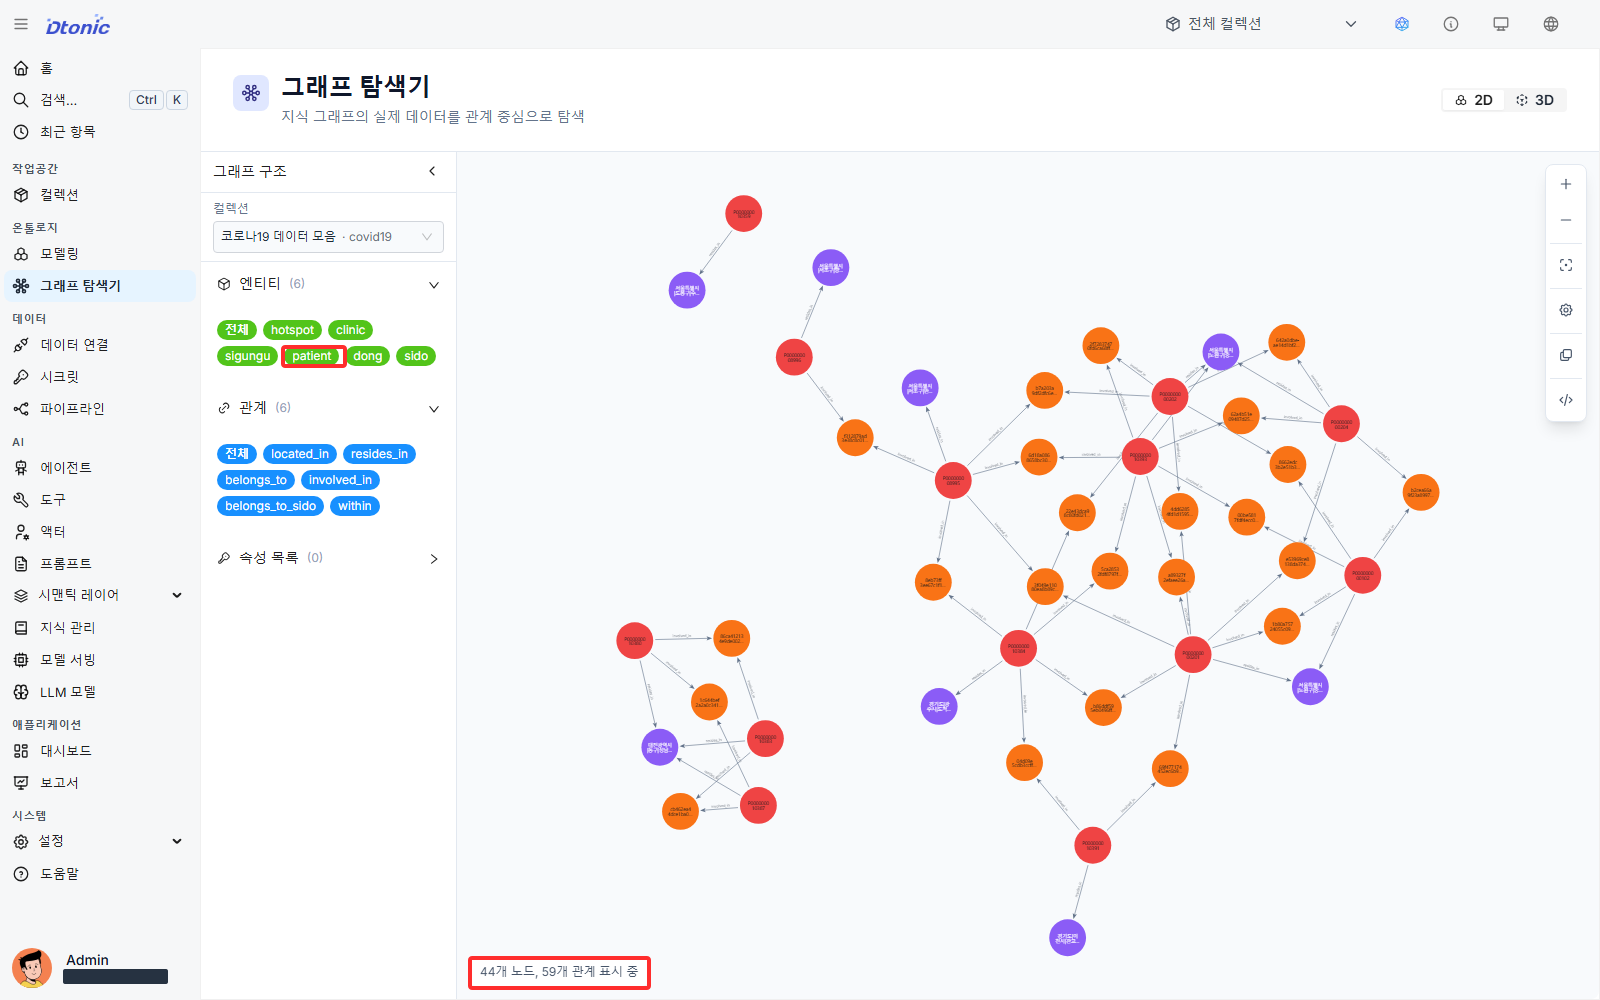
First, select the Patient (patient) entity to confirm that data was loaded, then open the query
console.
The following query returns the complete path from a patient through a hotspot and dong to its sigungu and sido.
MATCH path = (p:patient)-[:involved_in]->(h:hotspot)-[:within]->(d:dong)
             -[:belongs_to]->(sg:sigungu)-[:belongs_to_sido]->(s:sido)
RETURN path
LIMIT 25
It starts with a patient, expands through the visited hotspot and its dong, and continues to the
sigungu and sido. RETURN path returns the connecting edges as well as the nodes.
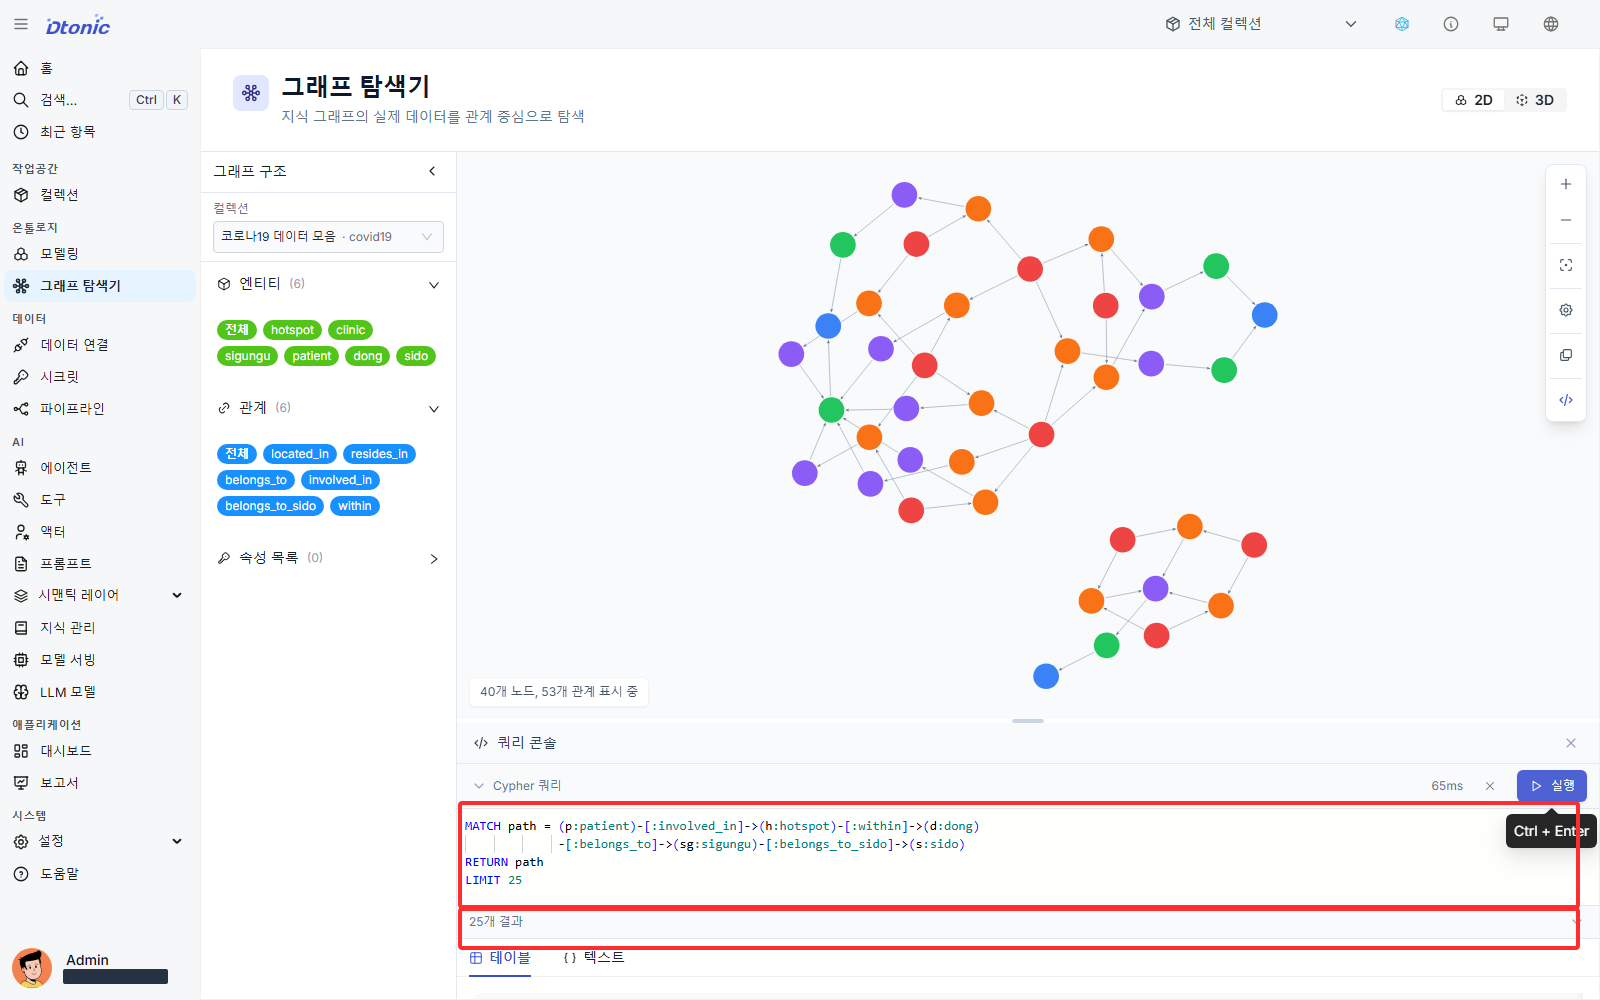
Expected result: you can see one connected path that shows which dong contains each patient and hotspot, and which sigungu and sido contain that dong. This tells you which higher administrative unit should receive the observation.
Next, expand only the hotspots and patients connected to Junggye 4-dong.
MATCH path = (d:dong {dong: '중계4동'})
             <-[:within]-(h:hotspot)<-[:involved_in]-(p:patient)
RETURN path
LIMIT 50
This time the query starts with Junggye 4-dong and follows relations backward to its hotspots and patients. It narrows the first query to reveal movement-intersection structure inside one area.
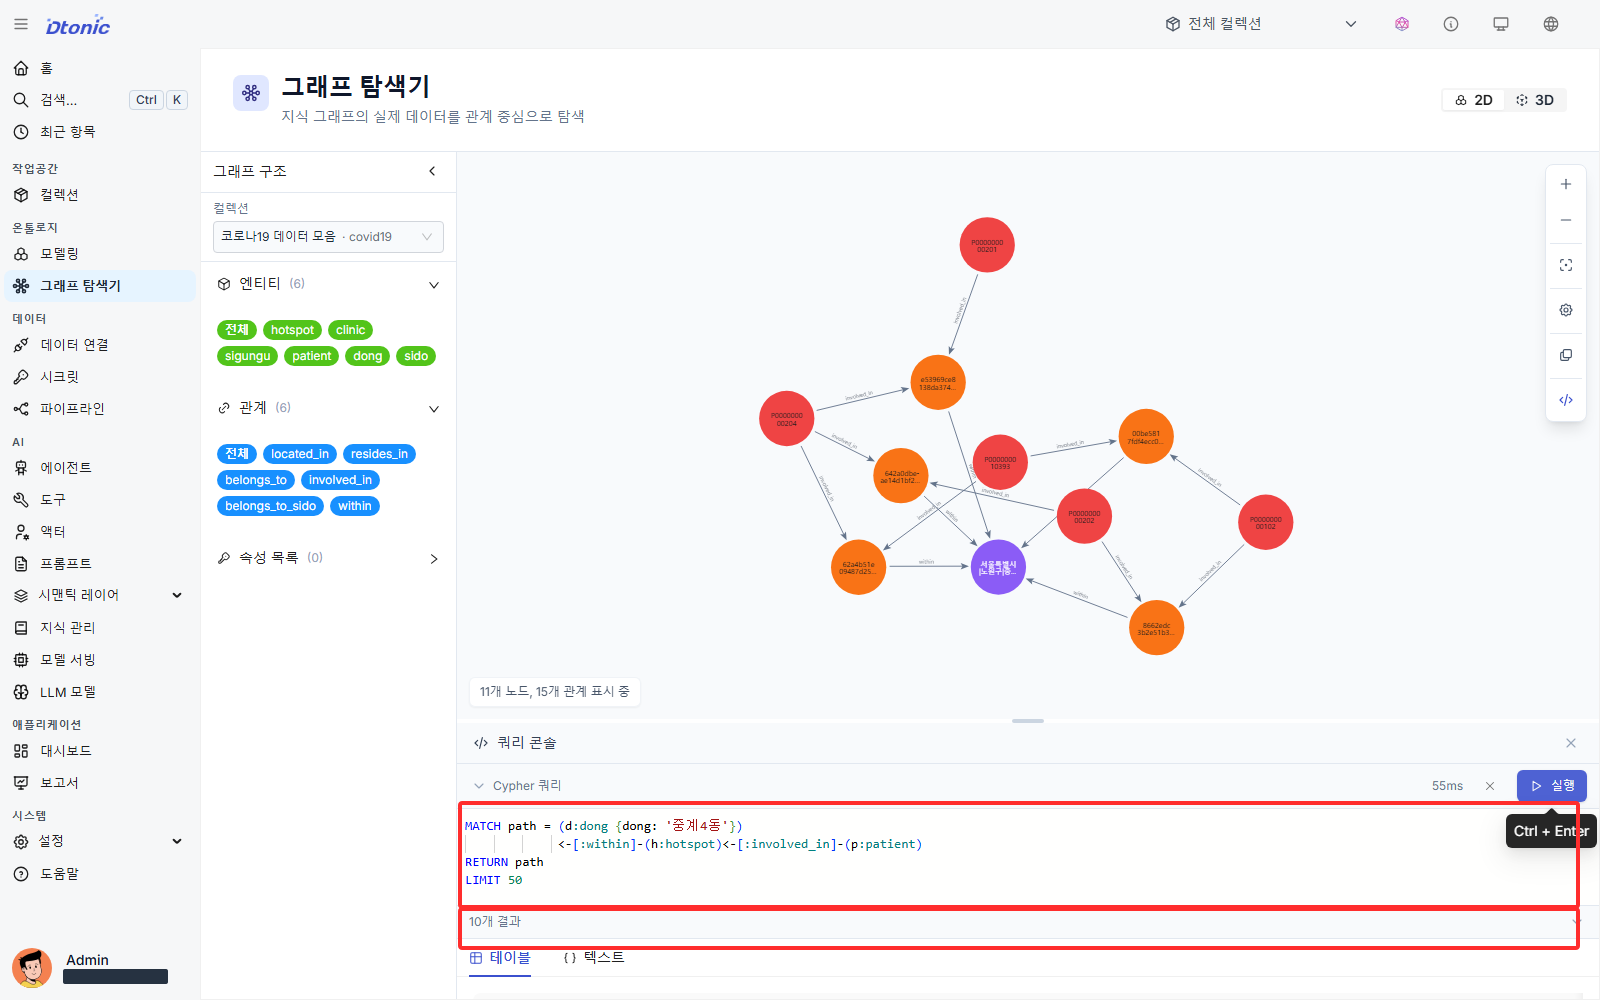
Expected result: you can inspect whether several patients connect to one hotspot or one patient connects to several hotspots in Junggye 4-dong. Start follow-up checks with the places where connections converge, then inspect their original occurrence times and locations.
Both queries should display nodes and edges rather than No graph data. If you see circles without
connections, confirm that you used RETURN path, rather than returning p, h, d... separately.
Read the result
The first result traces one patient's location context to a broad administrative unit. The second narrows the view to show where patient routes intersect in Junggye 4-dong. A recorded connection is not proof of causation.
First graph: find the reporting unit
The patient → hotspot → dong → sigungu → sido path connects a patient to higher administrative
regions. Use it to decide which sigungu owner should receive an observation and whether comparison with
other dong in the same area is warranted.
Second graph: inspect connection density in one area
Starting with Junggye 4-dong leaves only that dong's hotspots and patients. Read whether several patients connect to one hotspot and whether one patient connects to several hotspots before interpreting node size.
| Graph pattern | Next analytical question |
|---|---|
| Several patients connect to one hotspot | Did they actually overlap in the same time window? |
| One patient connects to several hotspots | Does the route extend into adjacent areas? |
| Connections concentrate at one place | Do facility type or opening hours reveal a shared condition? |
| Very few connections appear | Is data missing, or are routes genuinely dispersed? |
The graph is an exploration view for choosing which rows and times to inspect next, not proof of
what happened. After finding a suspicious connection, check cross_start_time and cross_end_time in
the source Hotspot Analysis Result (hotspot_result) dataset.
Next decision
The graph shows how hotspots and patients connect in Junggye 4-dong. To decide whether it should be checked before another area, compare Junggye 4-dong, Seongnam-dong, and Junggye Bon-dong by the same criteria in the next chapter.