Understand the three-sigma check intuitively
Compare each sensor with its normal distribution and distinguish a statistical alert from an explicit quality signal.
Question for this chapter
What does a three-sigma check find, and what effect does it have on these three alerts?
Why this matters now
Sigma sounds abstract, but its job is simple: express how many standard deviations a reading is from the average of the same sensor type. That creates a relative scale across different units.
Try it
Open the anomaly_detection pipeline under processed and select Run. It runs
sensor_normalization and then anomaly_detection to populate anomaly_detections.
Read these two rules separately in the code.
Statistical rule: |value - mean for this sensor type| / standard deviation >= sigma
Status rule: if quality_flag starts with HIGH_, severity is HIGH regardless of z-score
Success looks like this
anomaly_detections contains three rows, all HIGH.
| Machine | Sensor | z-score | Severity | Direct reason for HIGH |
|---|---|---|---|---|
| CNC-03 | vibration | 2.83 | HIGH | HIGH_VIBRATION |
| CNC-05 | pressure | 1.15 | HIGH | HIGH_PRESSURE |
| CNC-09 | temperature | 1.92 | HIGH | HIGH_TEMP |
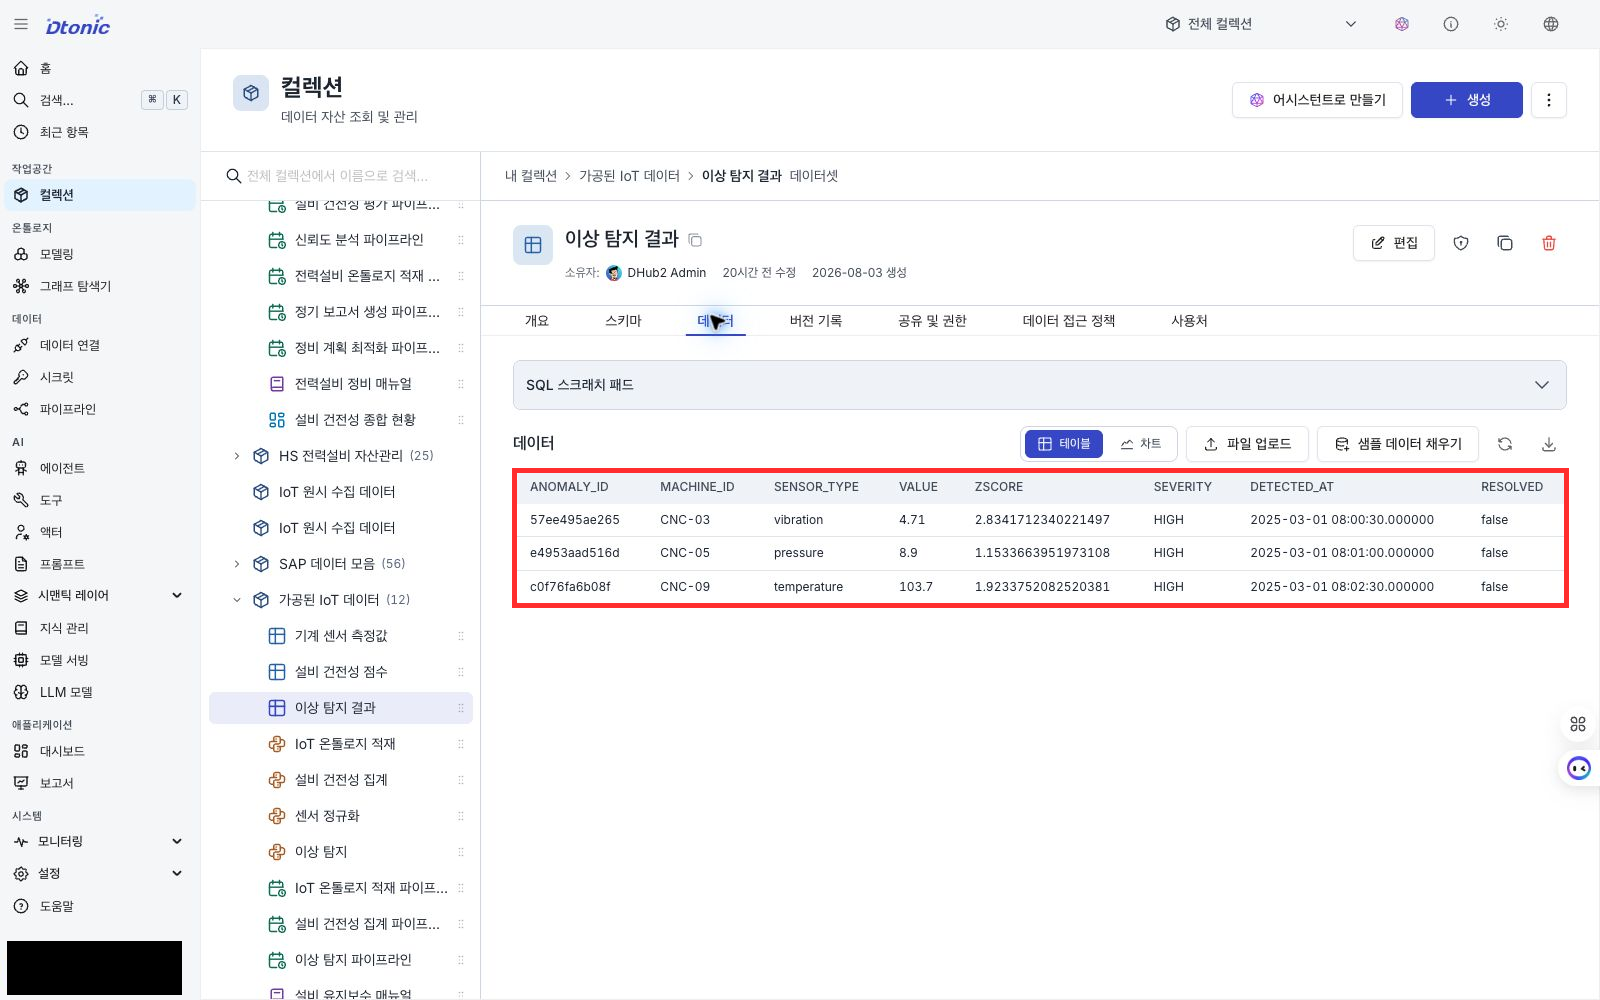
All three z-scores are below the default sigma of 3.0. The statistical rule added no rows in this sample; the source quality signals preserved all three.
Change the threshold once
Change sigma from 3.0 to 3.15 in the anomaly_detection code and run it again. The result is still
the same three HIGH rows. Restore 3.0 after the experiment.
Next decision
All three alerts are valid. Next, compress them into machine-level health scores and choose a first stop among the tie.