Read sensor values and quality signals together
Inspect 20 sensor rows and trace the three HIGH alerts to their source values, units, and quality signals.
Question for this chapter
Did the alerts come from large numbers or from status signals sent by the sensors?
Why this matters now
A temperature of 103.7 and a vibration value of 4.71 use different units and distributions. Comparing
the raw numbers directly puts unlike sensors on the same scale. Read value, unit, sensor_type, and
quality_flag as one piece of evidence.
Try it
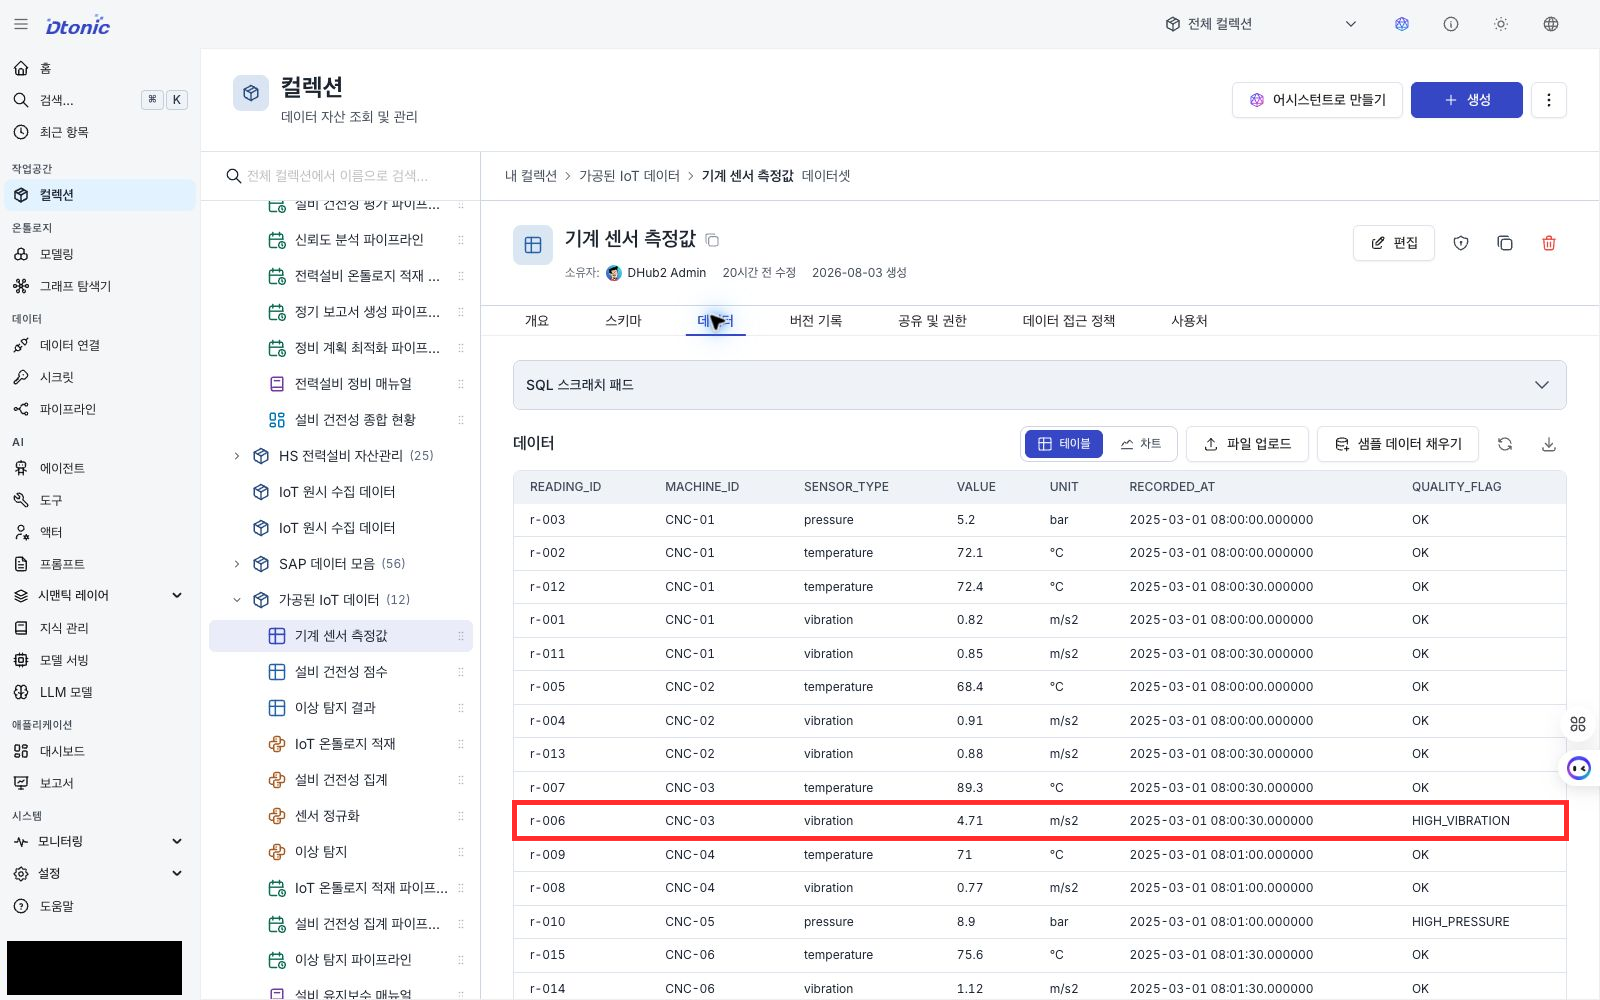
Open the preview of machine_sensors under processed. Show these columns and filter by
quality_flag.
machine_id, sensor_type, value, unit, recorded_at, quality_flag
Count quality_flag = OK, then keep only rows whose flag starts with HIGH_.
Success looks like this
Seventeen of the 20 rows are OK; three carry explicit high-risk signals.
| Machine | Sensor | Value | Quality signal | Time (UTC) |
|---|---|---|---|---|
| CNC-03 | vibration | 4.71 m/s² | HIGH_VIBRATION | 08:00:30 |
| CNC-05 | pressure | 8.9 bar | HIGH_PRESSURE | 08:01:00 |
| CNC-09 | temperature | 103.7 °C | HIGH_TEMP | 08:02:30 |
Interpret the result
These are not guesses based only on magnitude. Each source row already contains a sensor status signal. The next chapter's statistical threshold must not discard that signal when it changes slightly.
There are 17 distinct machine_id and sensor_type pairs. Only CNC-01 has all three sensor types;
other machines have one or two. Sensor count alone does not make CNC-01 the first inspection target.
The current decision starts from the three HIGH_* rows.
Next decision
You have traced the alerts to their source. Next, learn how a three-sigma check normalizes different sensors and why explicit quality signals take precedence here.